Outdated documentation
The latest documentation was moved to docs.qfield.org
By Benjamin Gnep, Schutzstation Wattenmeer e.V..
2019-07-29
The Wadden Sea in Denmark, Germany and The Netherlands is of outstanding importance for many breeding bird species. Annually, the Schutzstation Wattenmeer participates in the Wadden Sea wide trilateral monitoring and assessment program (TMAP) and monitors the number of breeding birds in more than 100 monitoring areas in Schleswig-Holstein / Germany. For a number of species we monitor a significant share of the entire German breeding population.
Most fieldwork is carried out by annually changing volunteers which usually do not have much experience. Good supervision during the monitoring period in spring is thus very important. At the same time the amount of collected data is a significant bureaucratic challenge.
Until 2018 printed paper maps were used to collect the data in the field. Major disadvantages of the analogue system were:
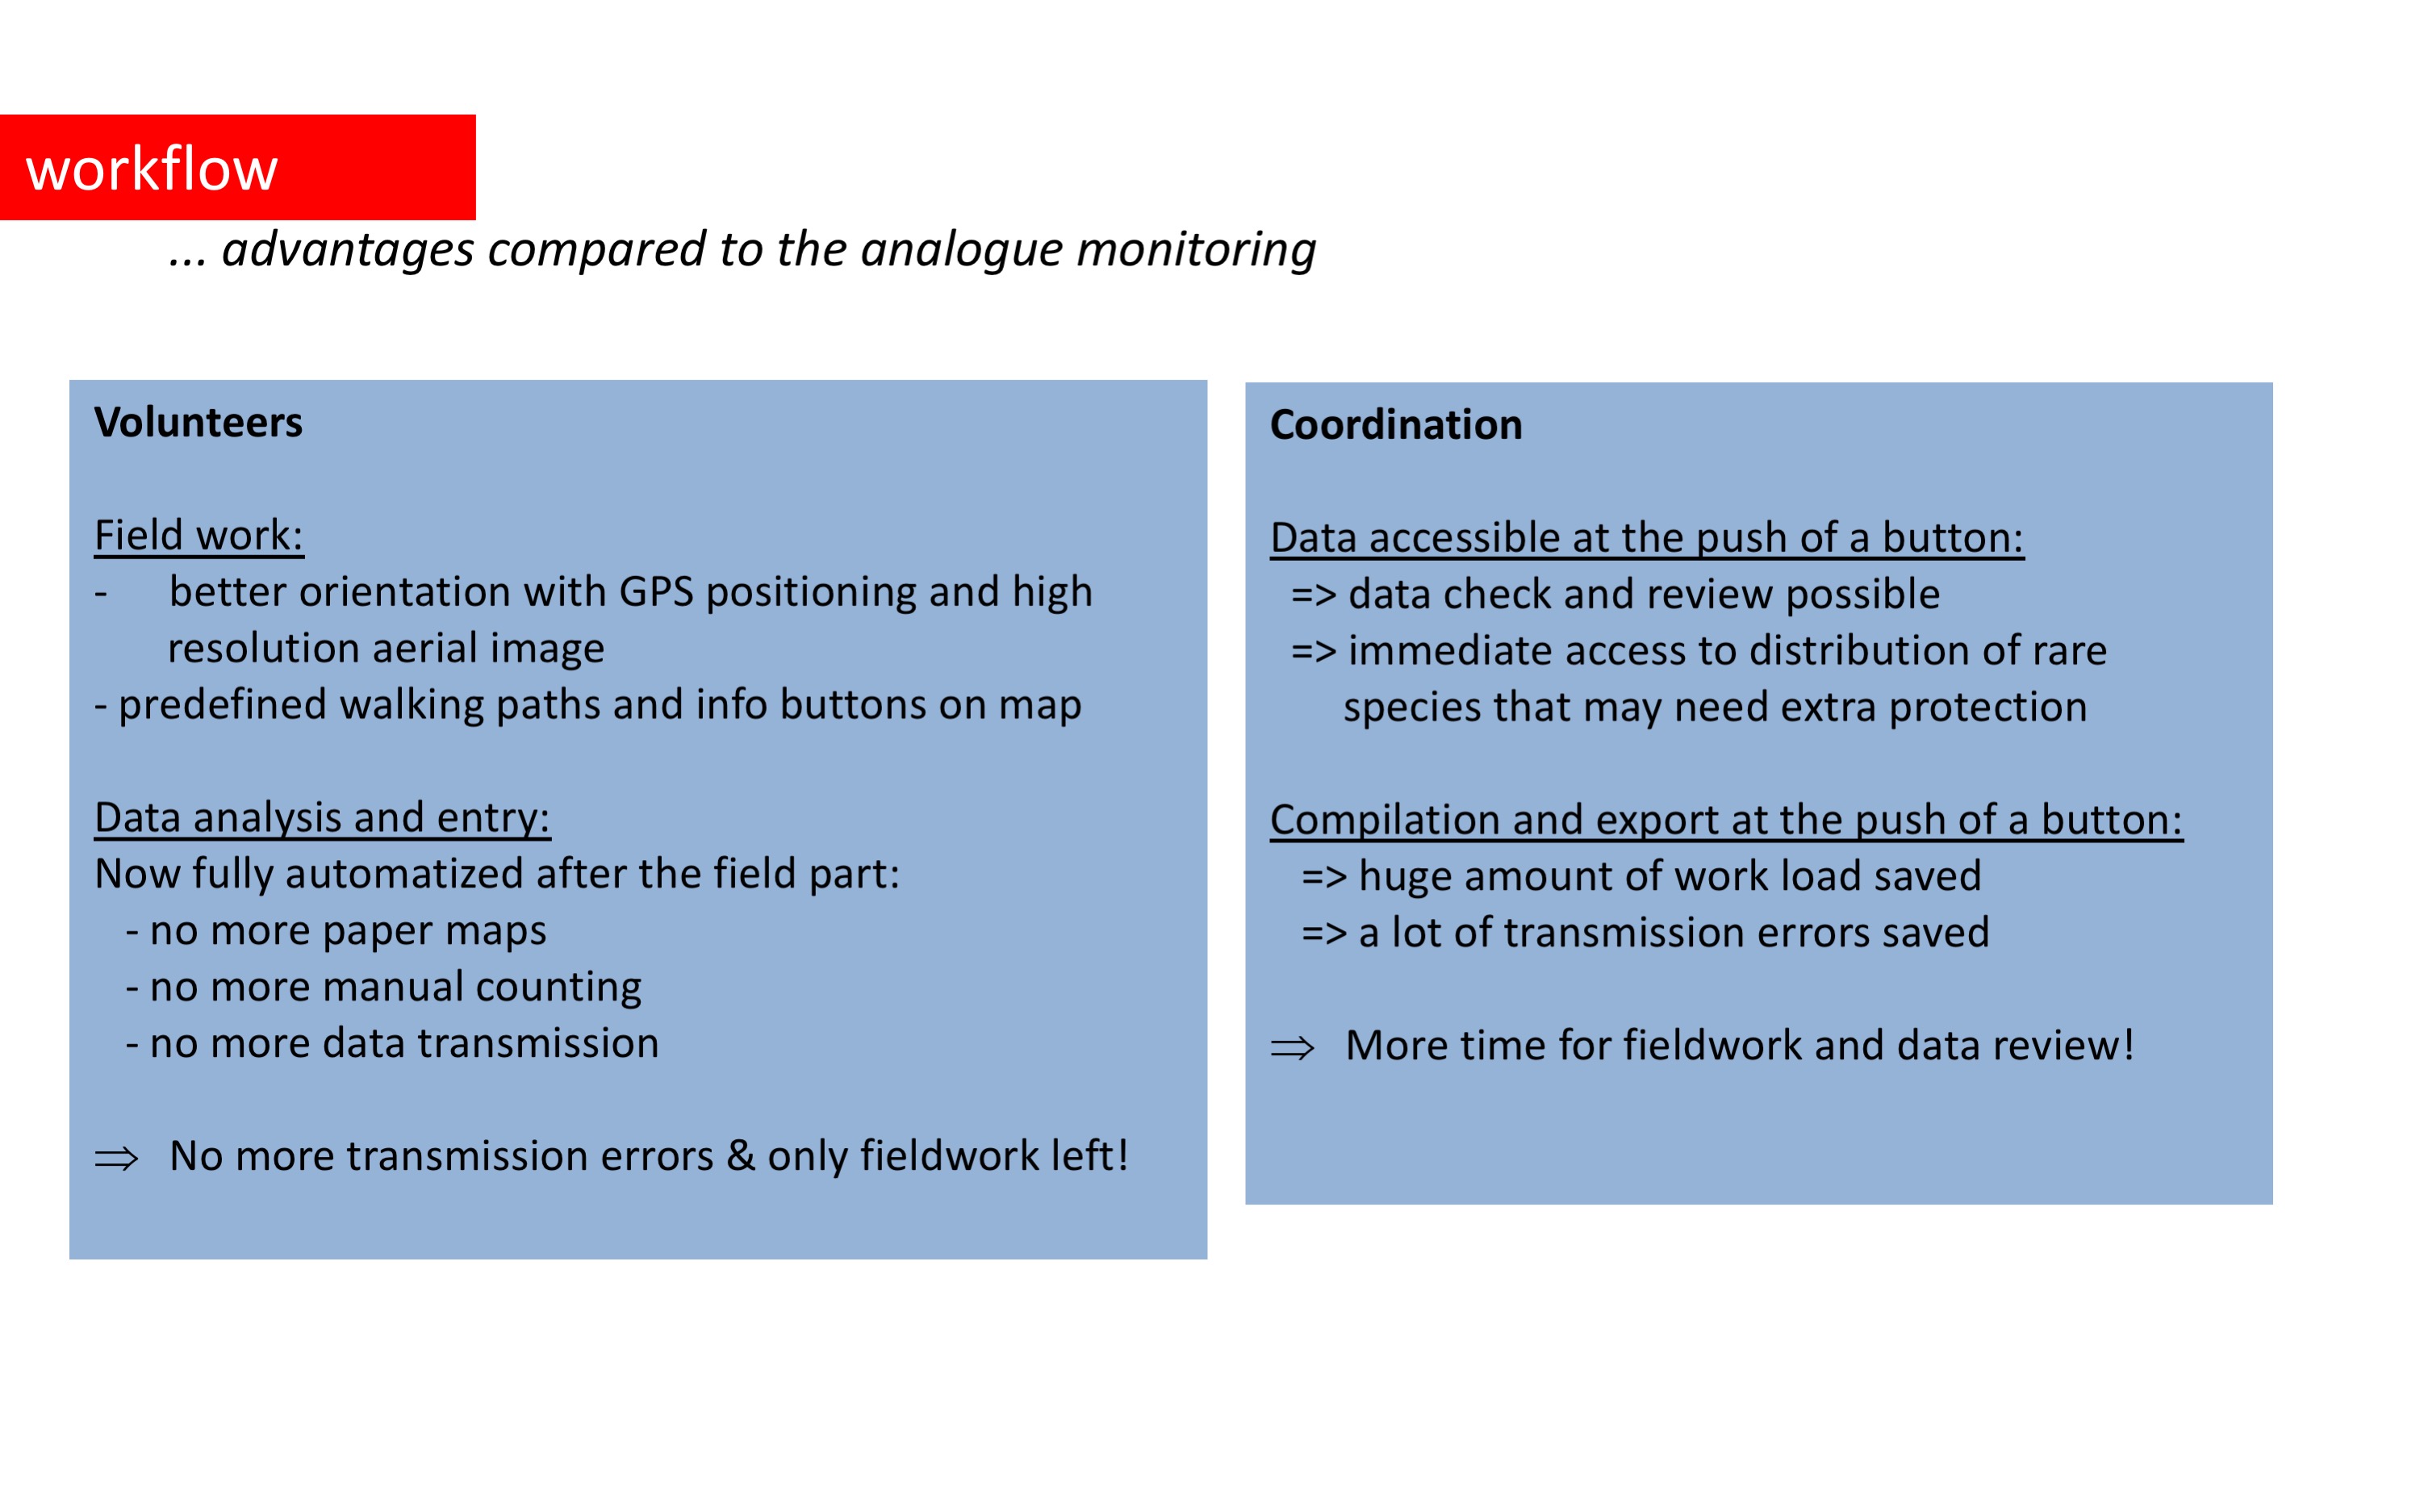
- orientation in the field was rather difficult without GPS positioning
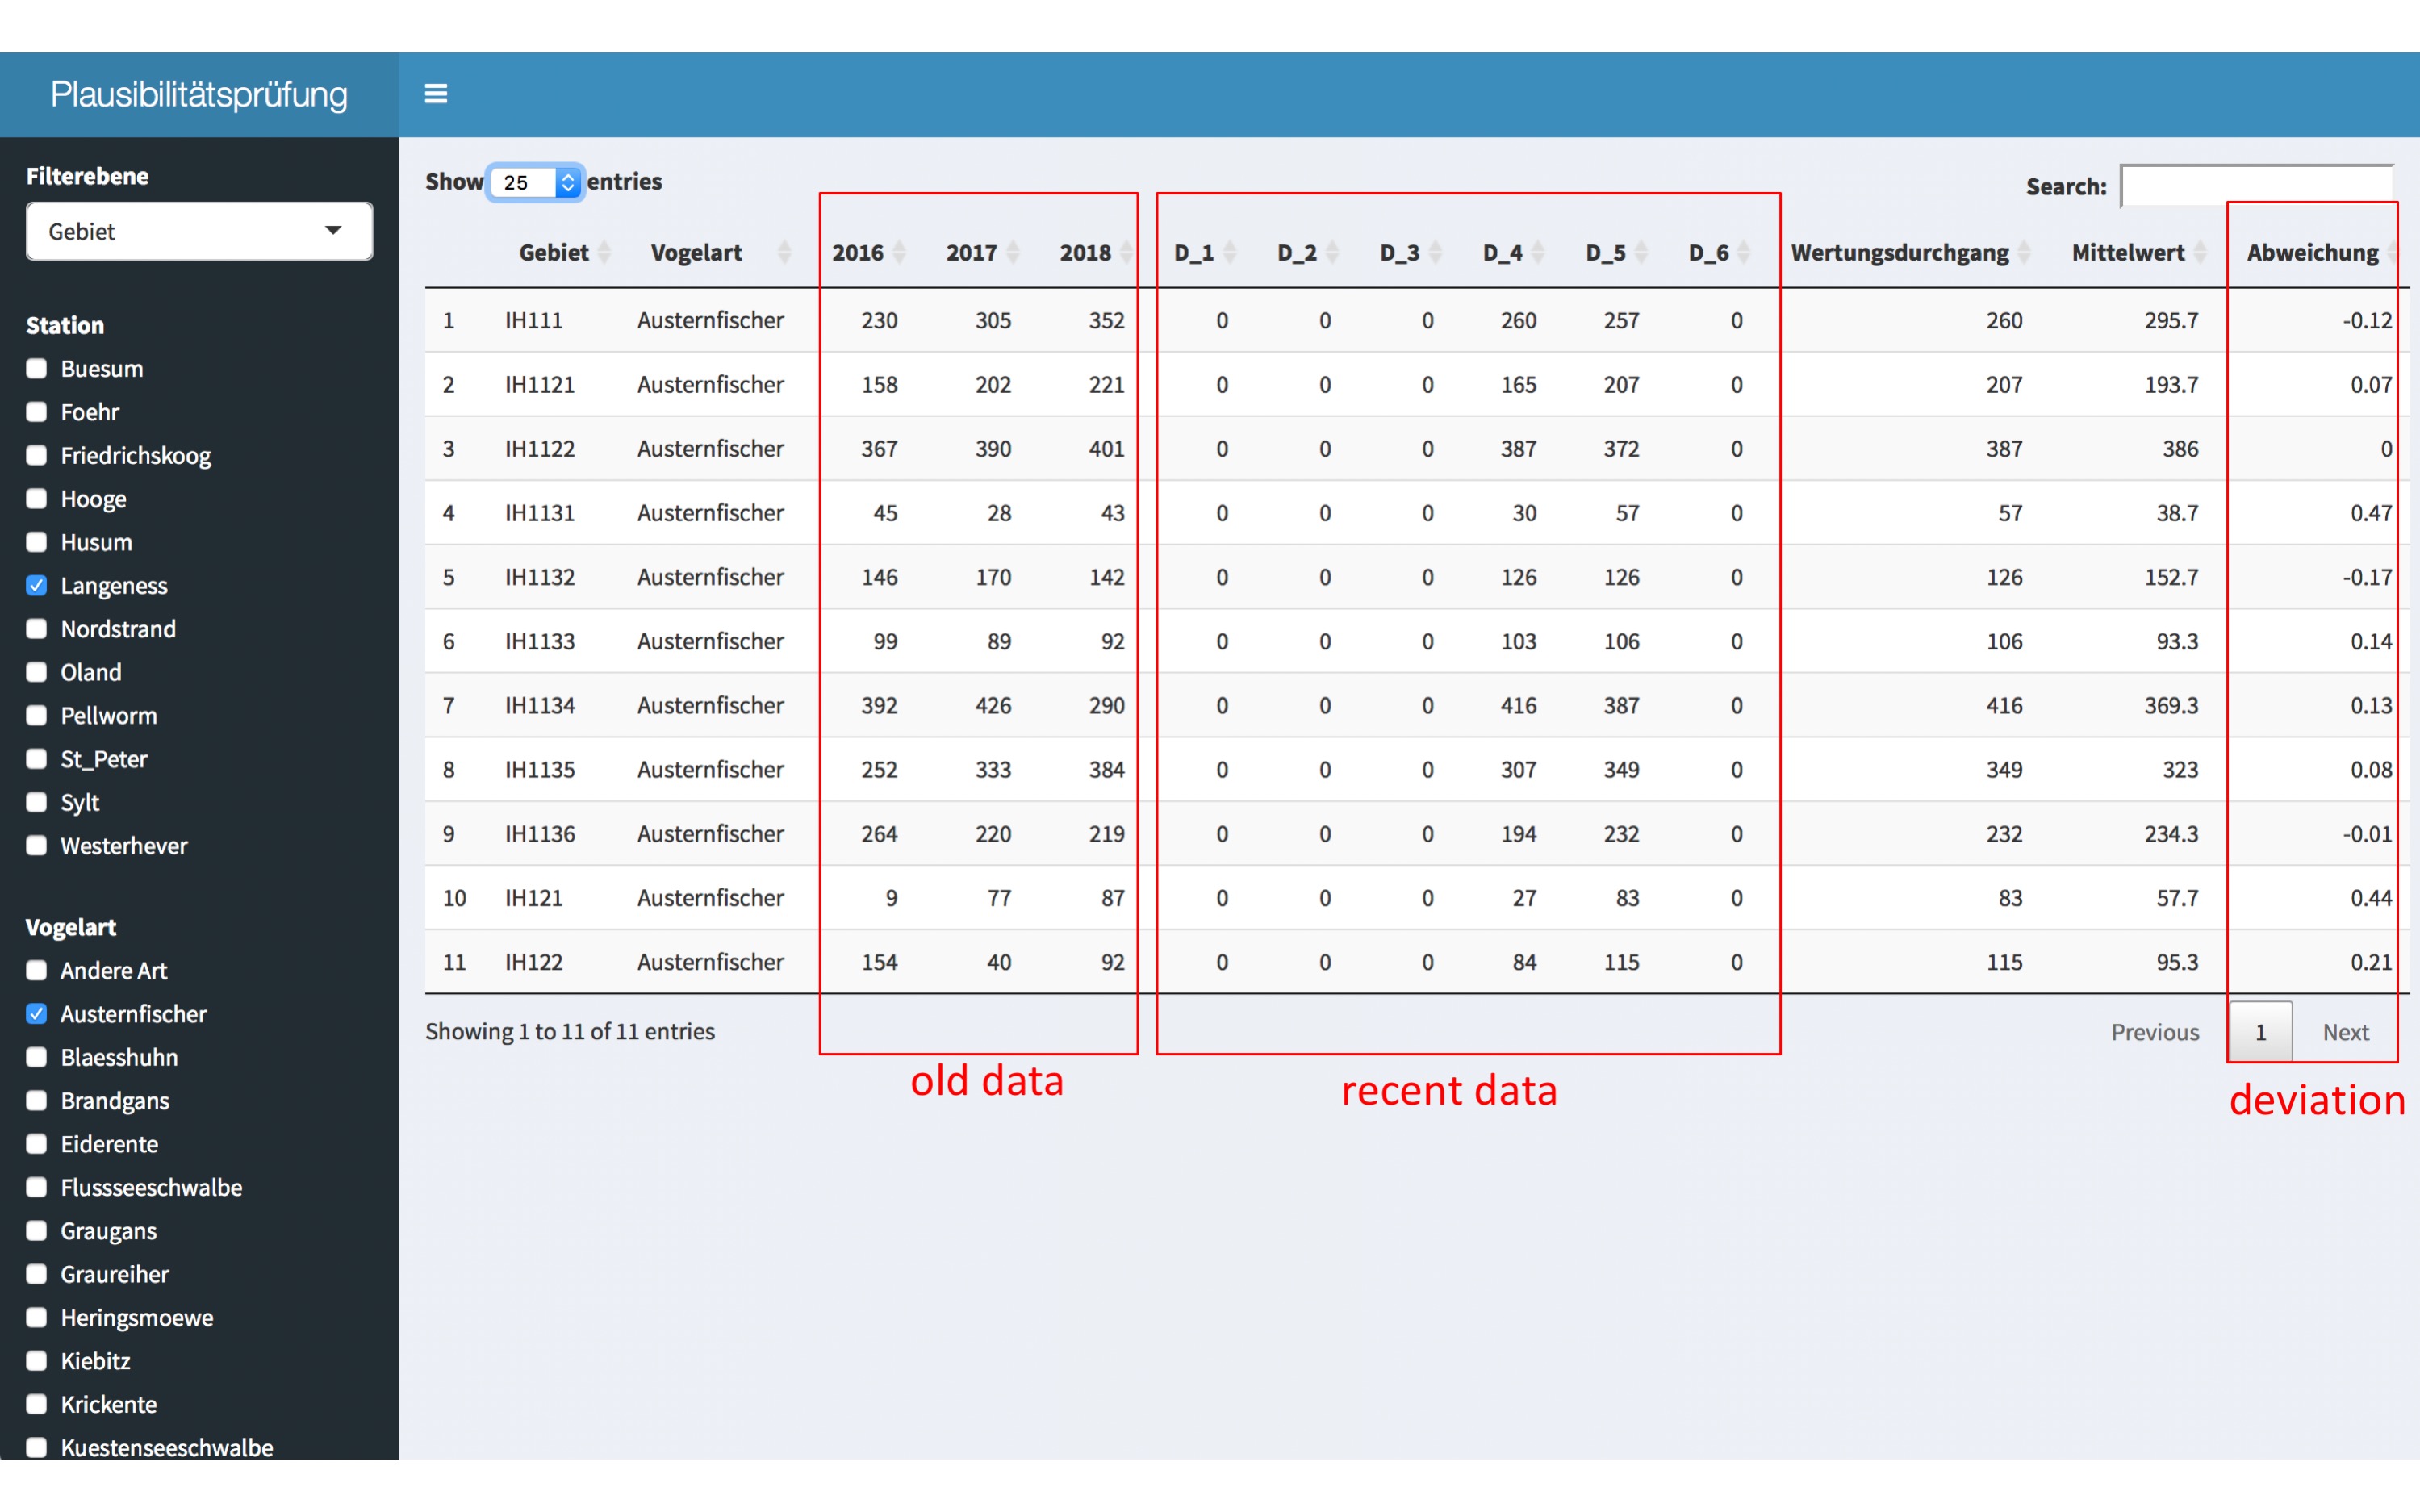
- all results had to be counted and transferred to data tables and GIS manually, transmission errors were likely (about 18,000 observations are collected every year)
- data could only be reviewed after the monitoring period and unlikely observations could not be checked directly
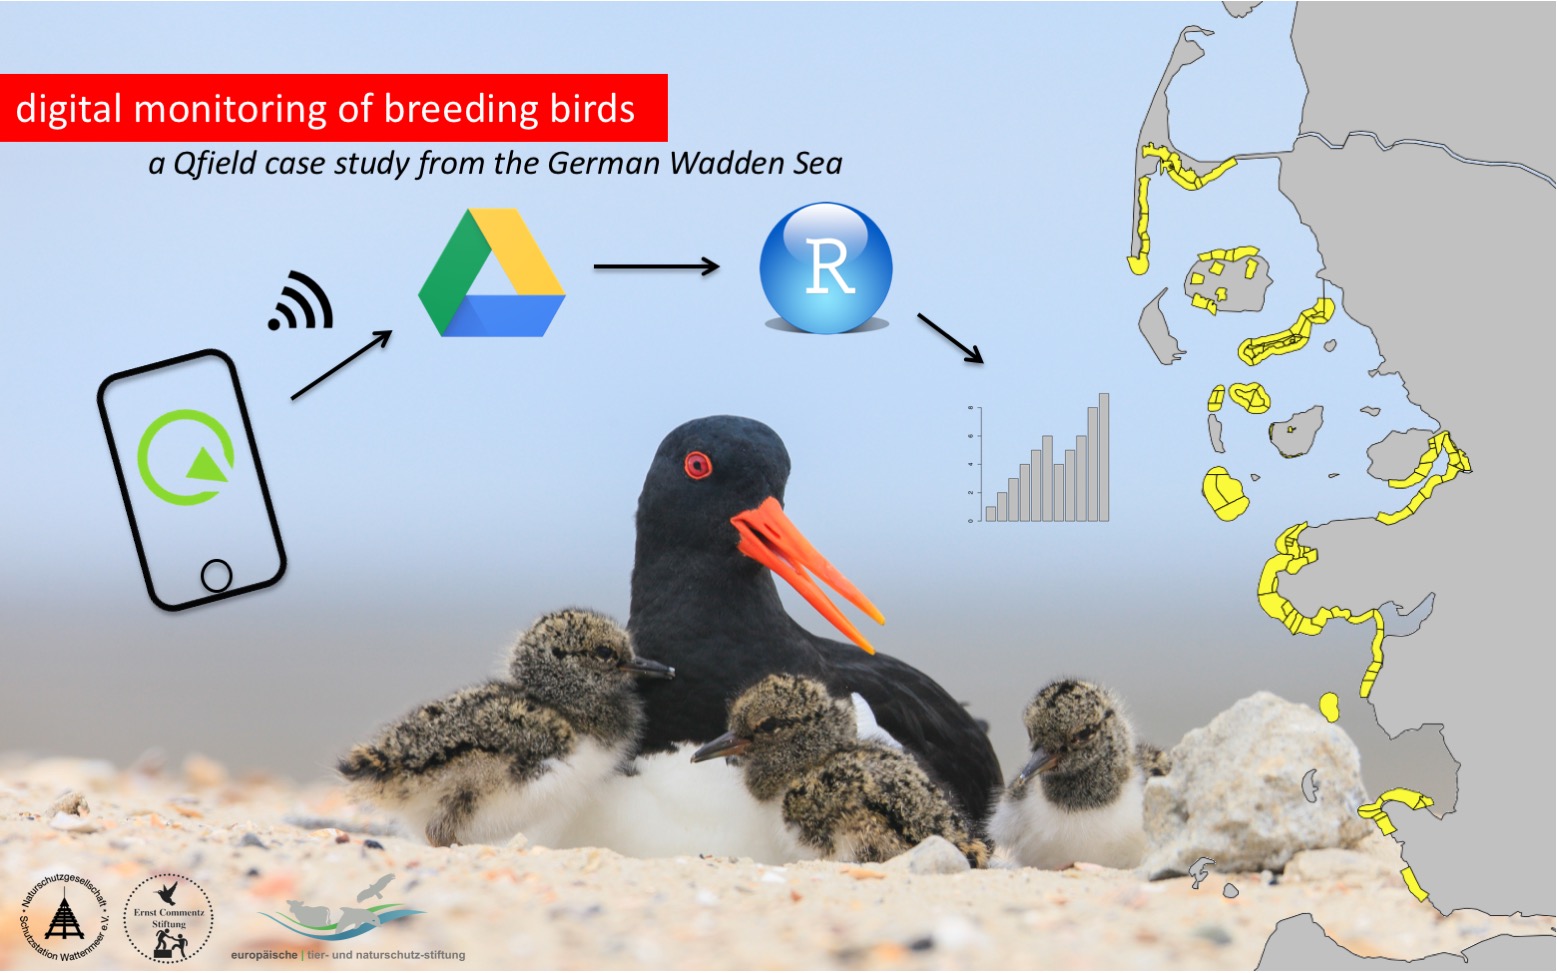
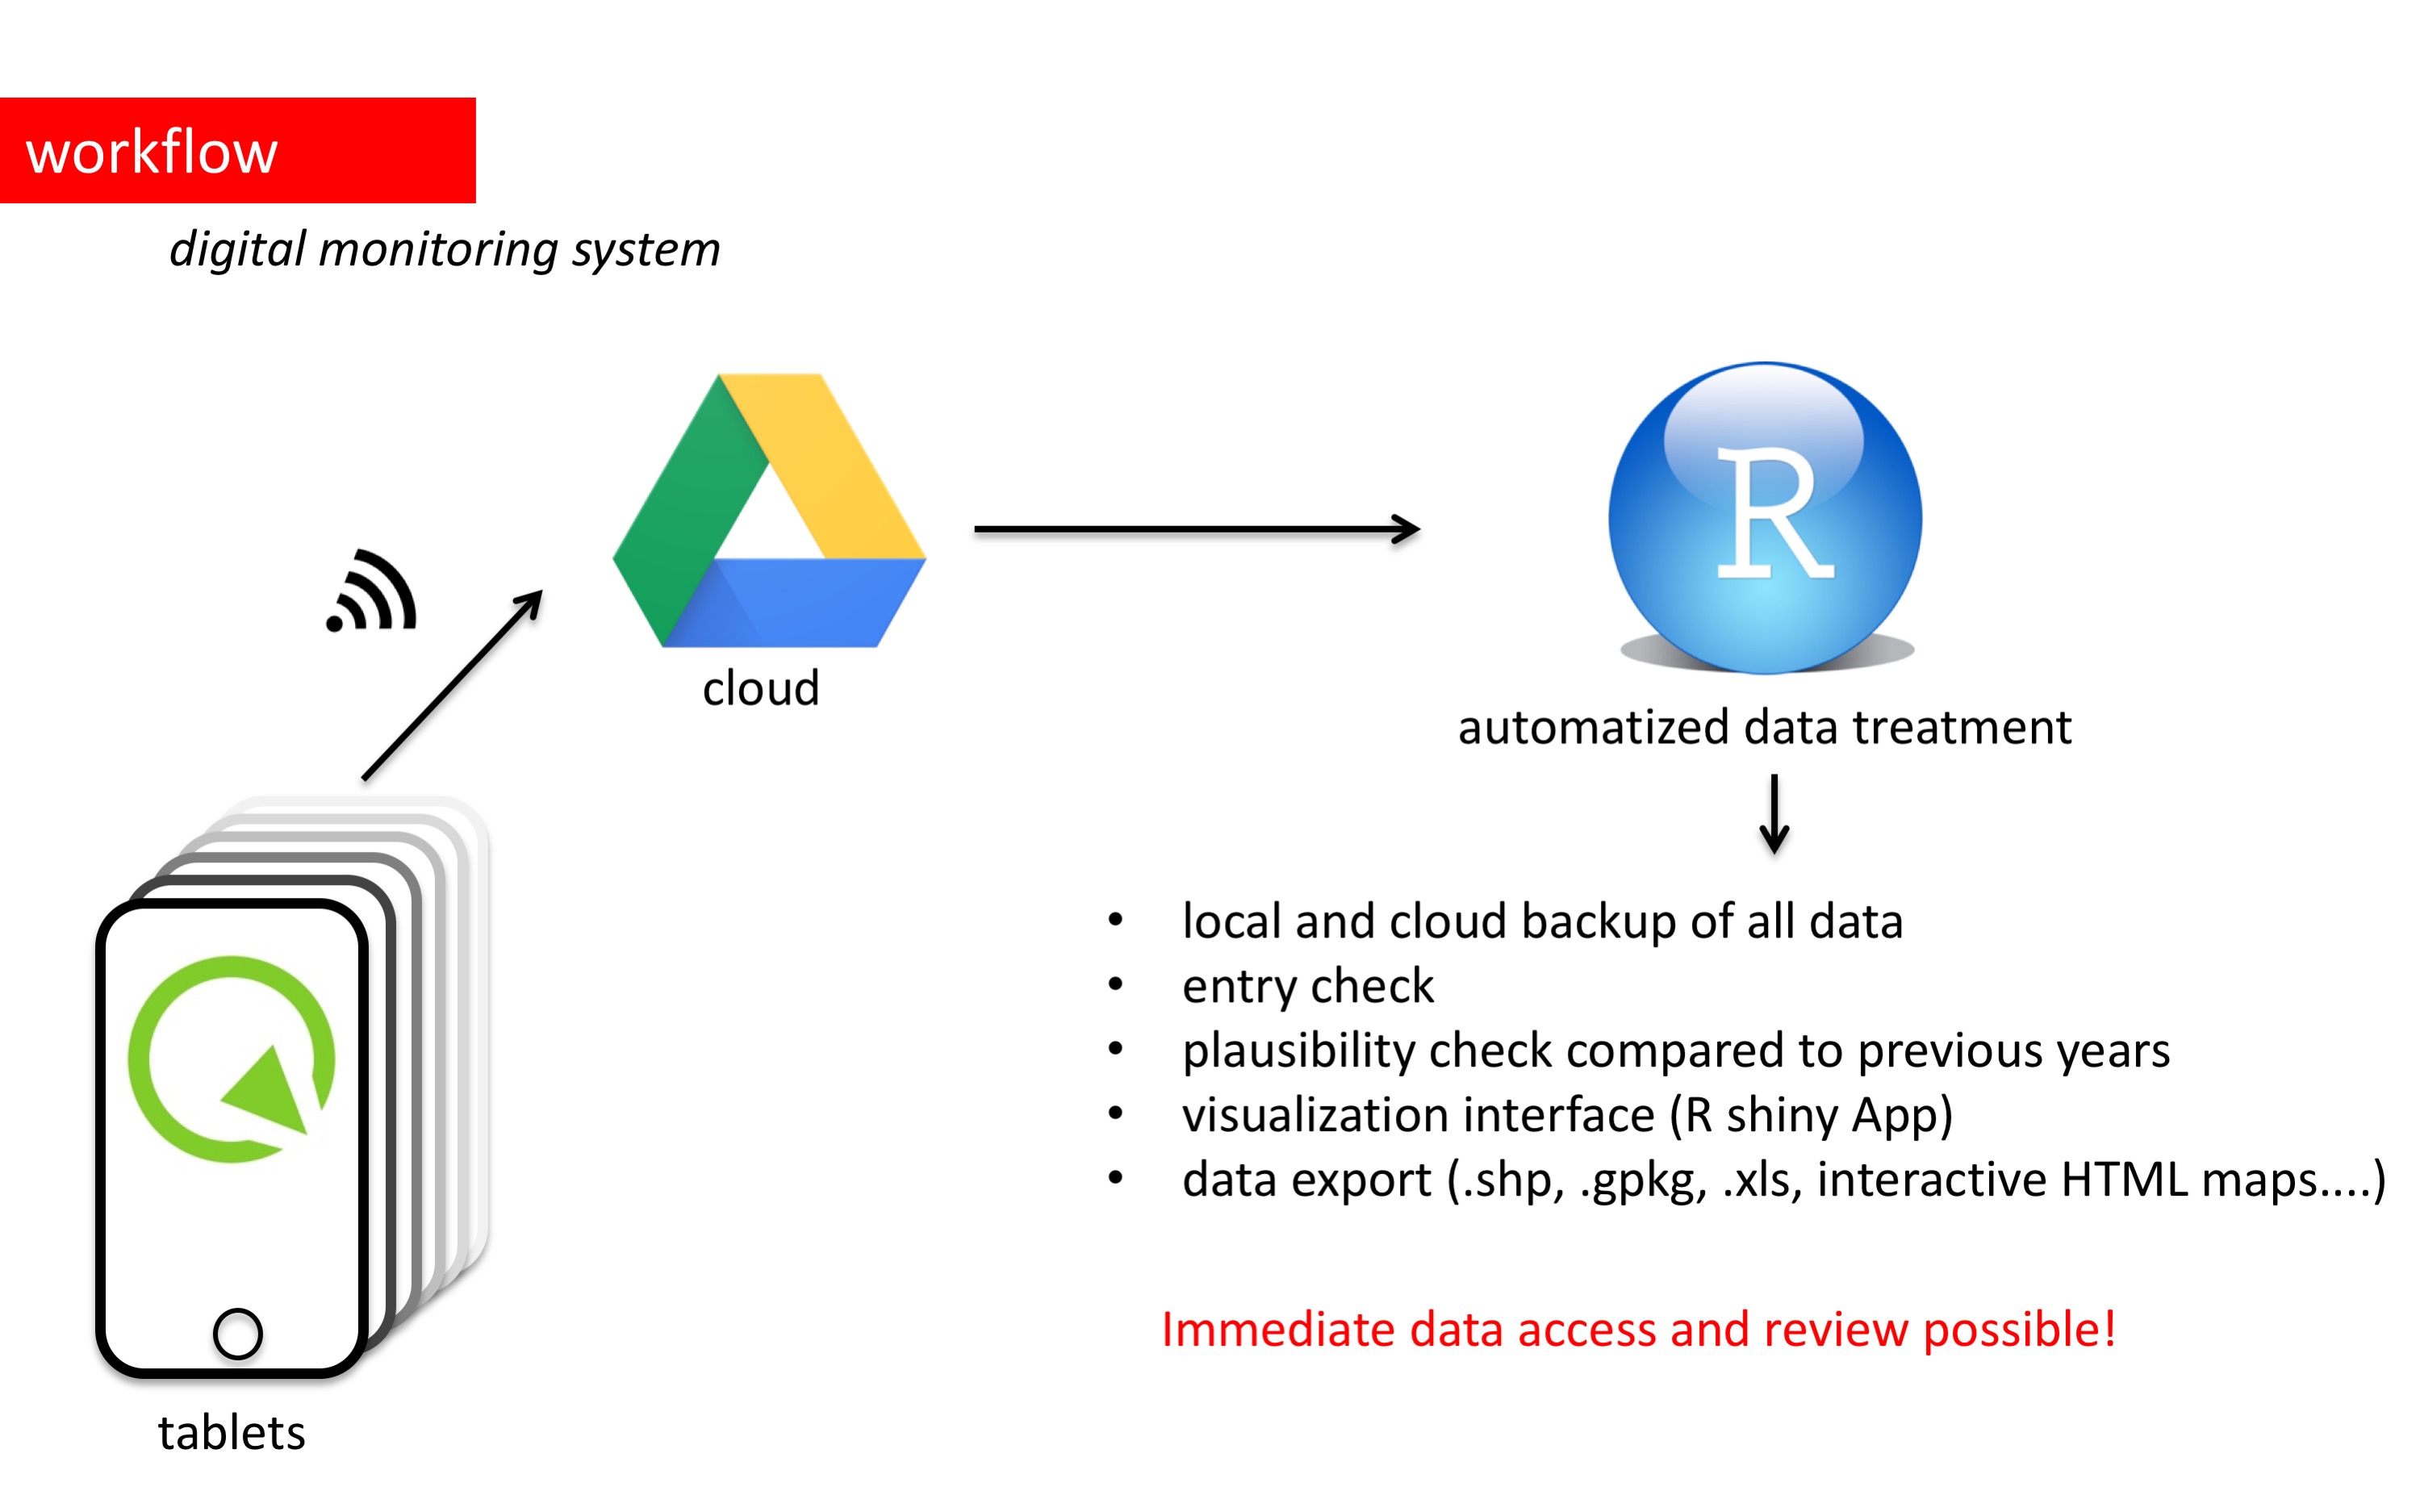
For this reason, we have implemented a digital monitoring workflow using the power of QField, the advantages of a cloud storage system and the computational power of R. Most tasks are now fully automatized in R. Via the cloud data from all areas can be accessed and evaluated with daily topicality.
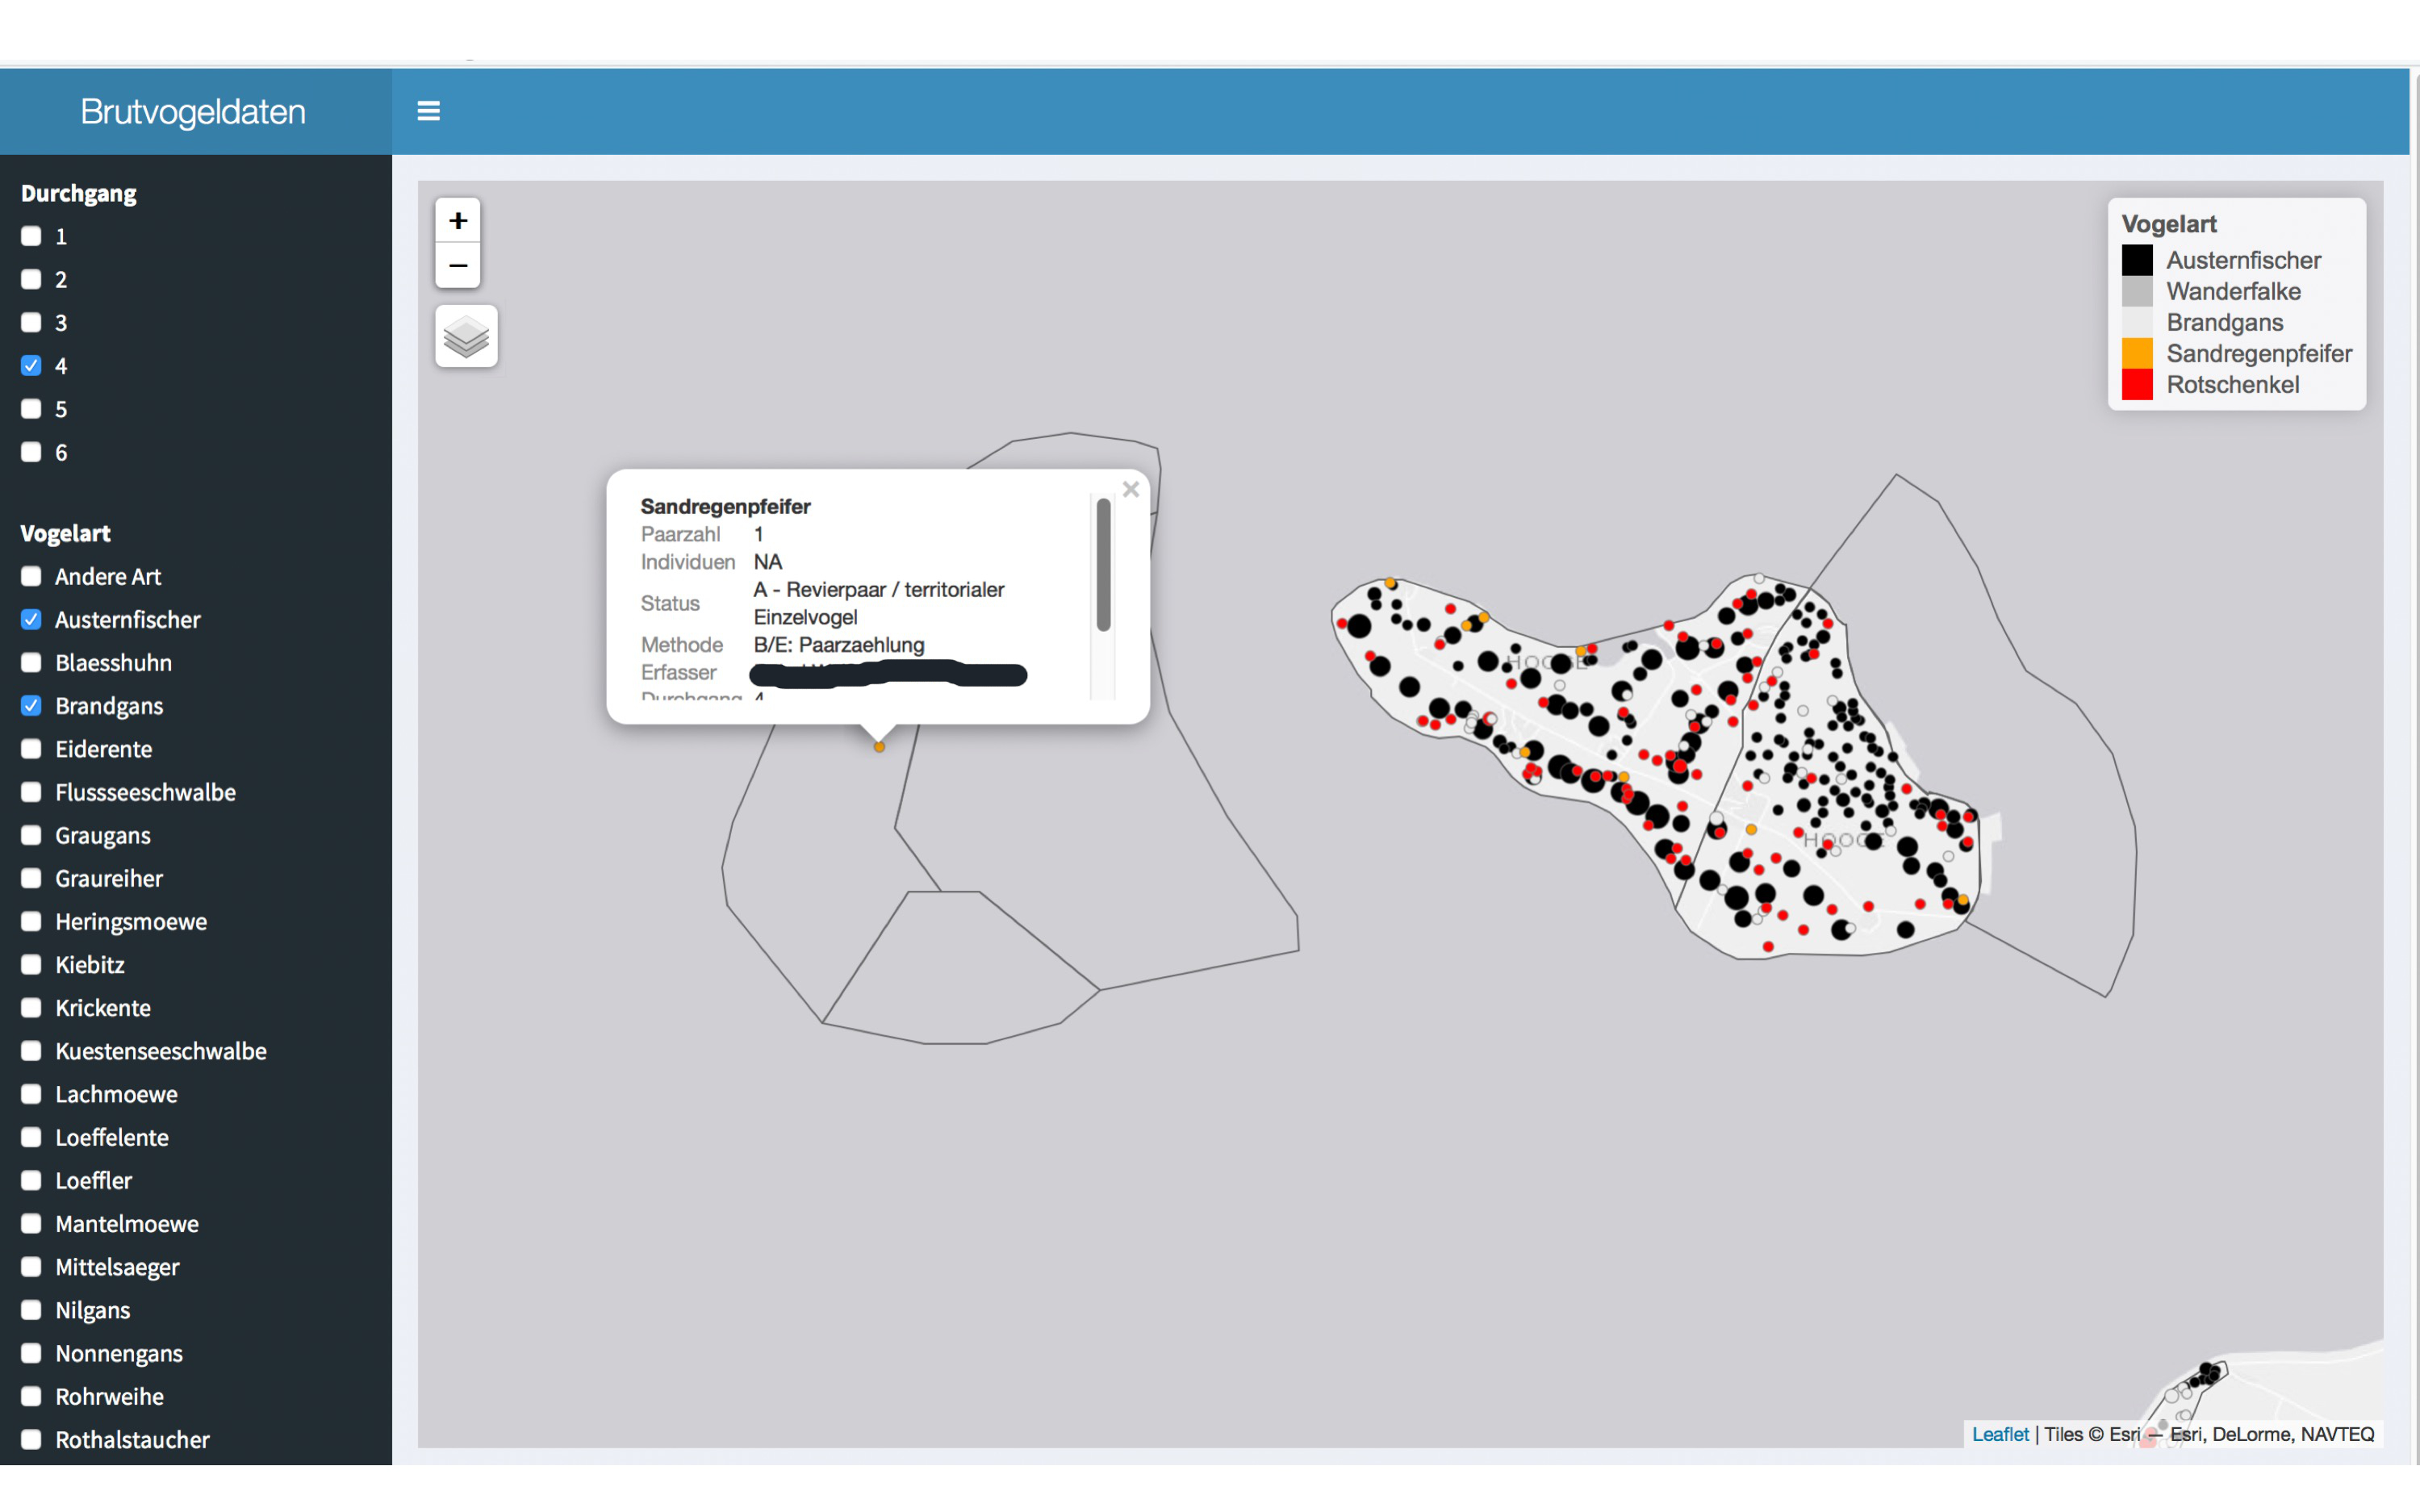
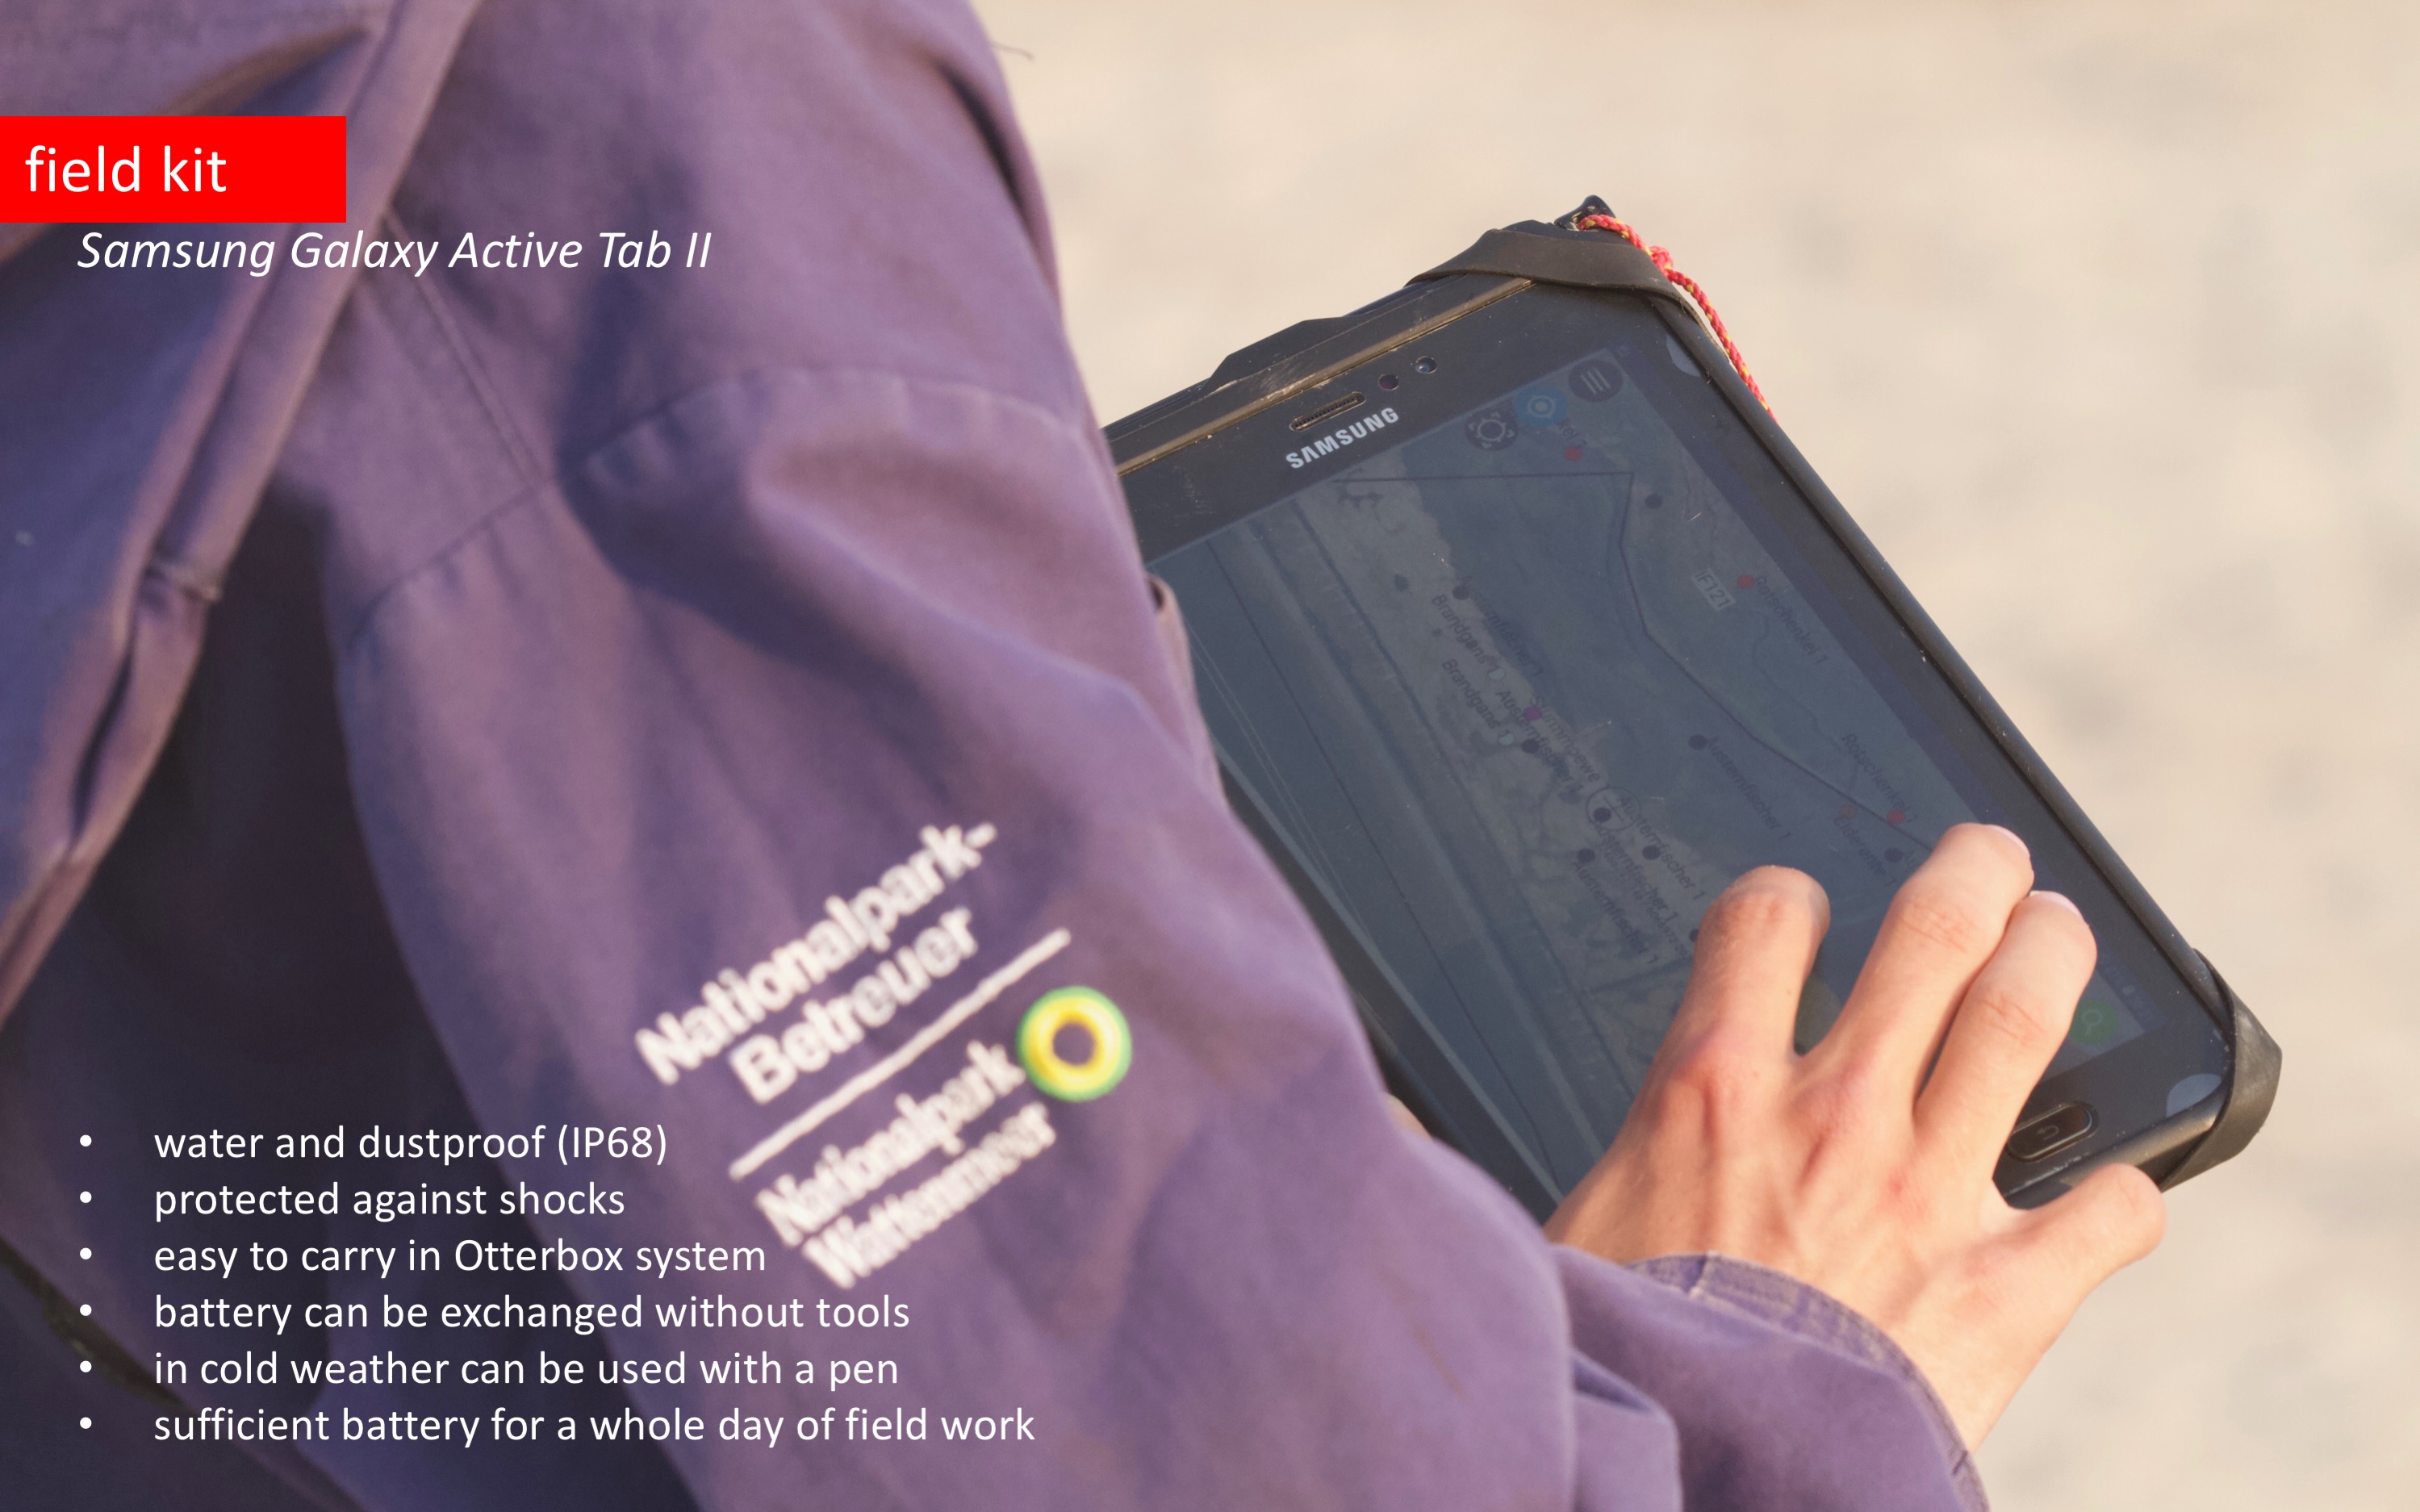
In spring 2019 we tested our system with seven tablet devices spread over seven of in total 12 different monitoring stations.
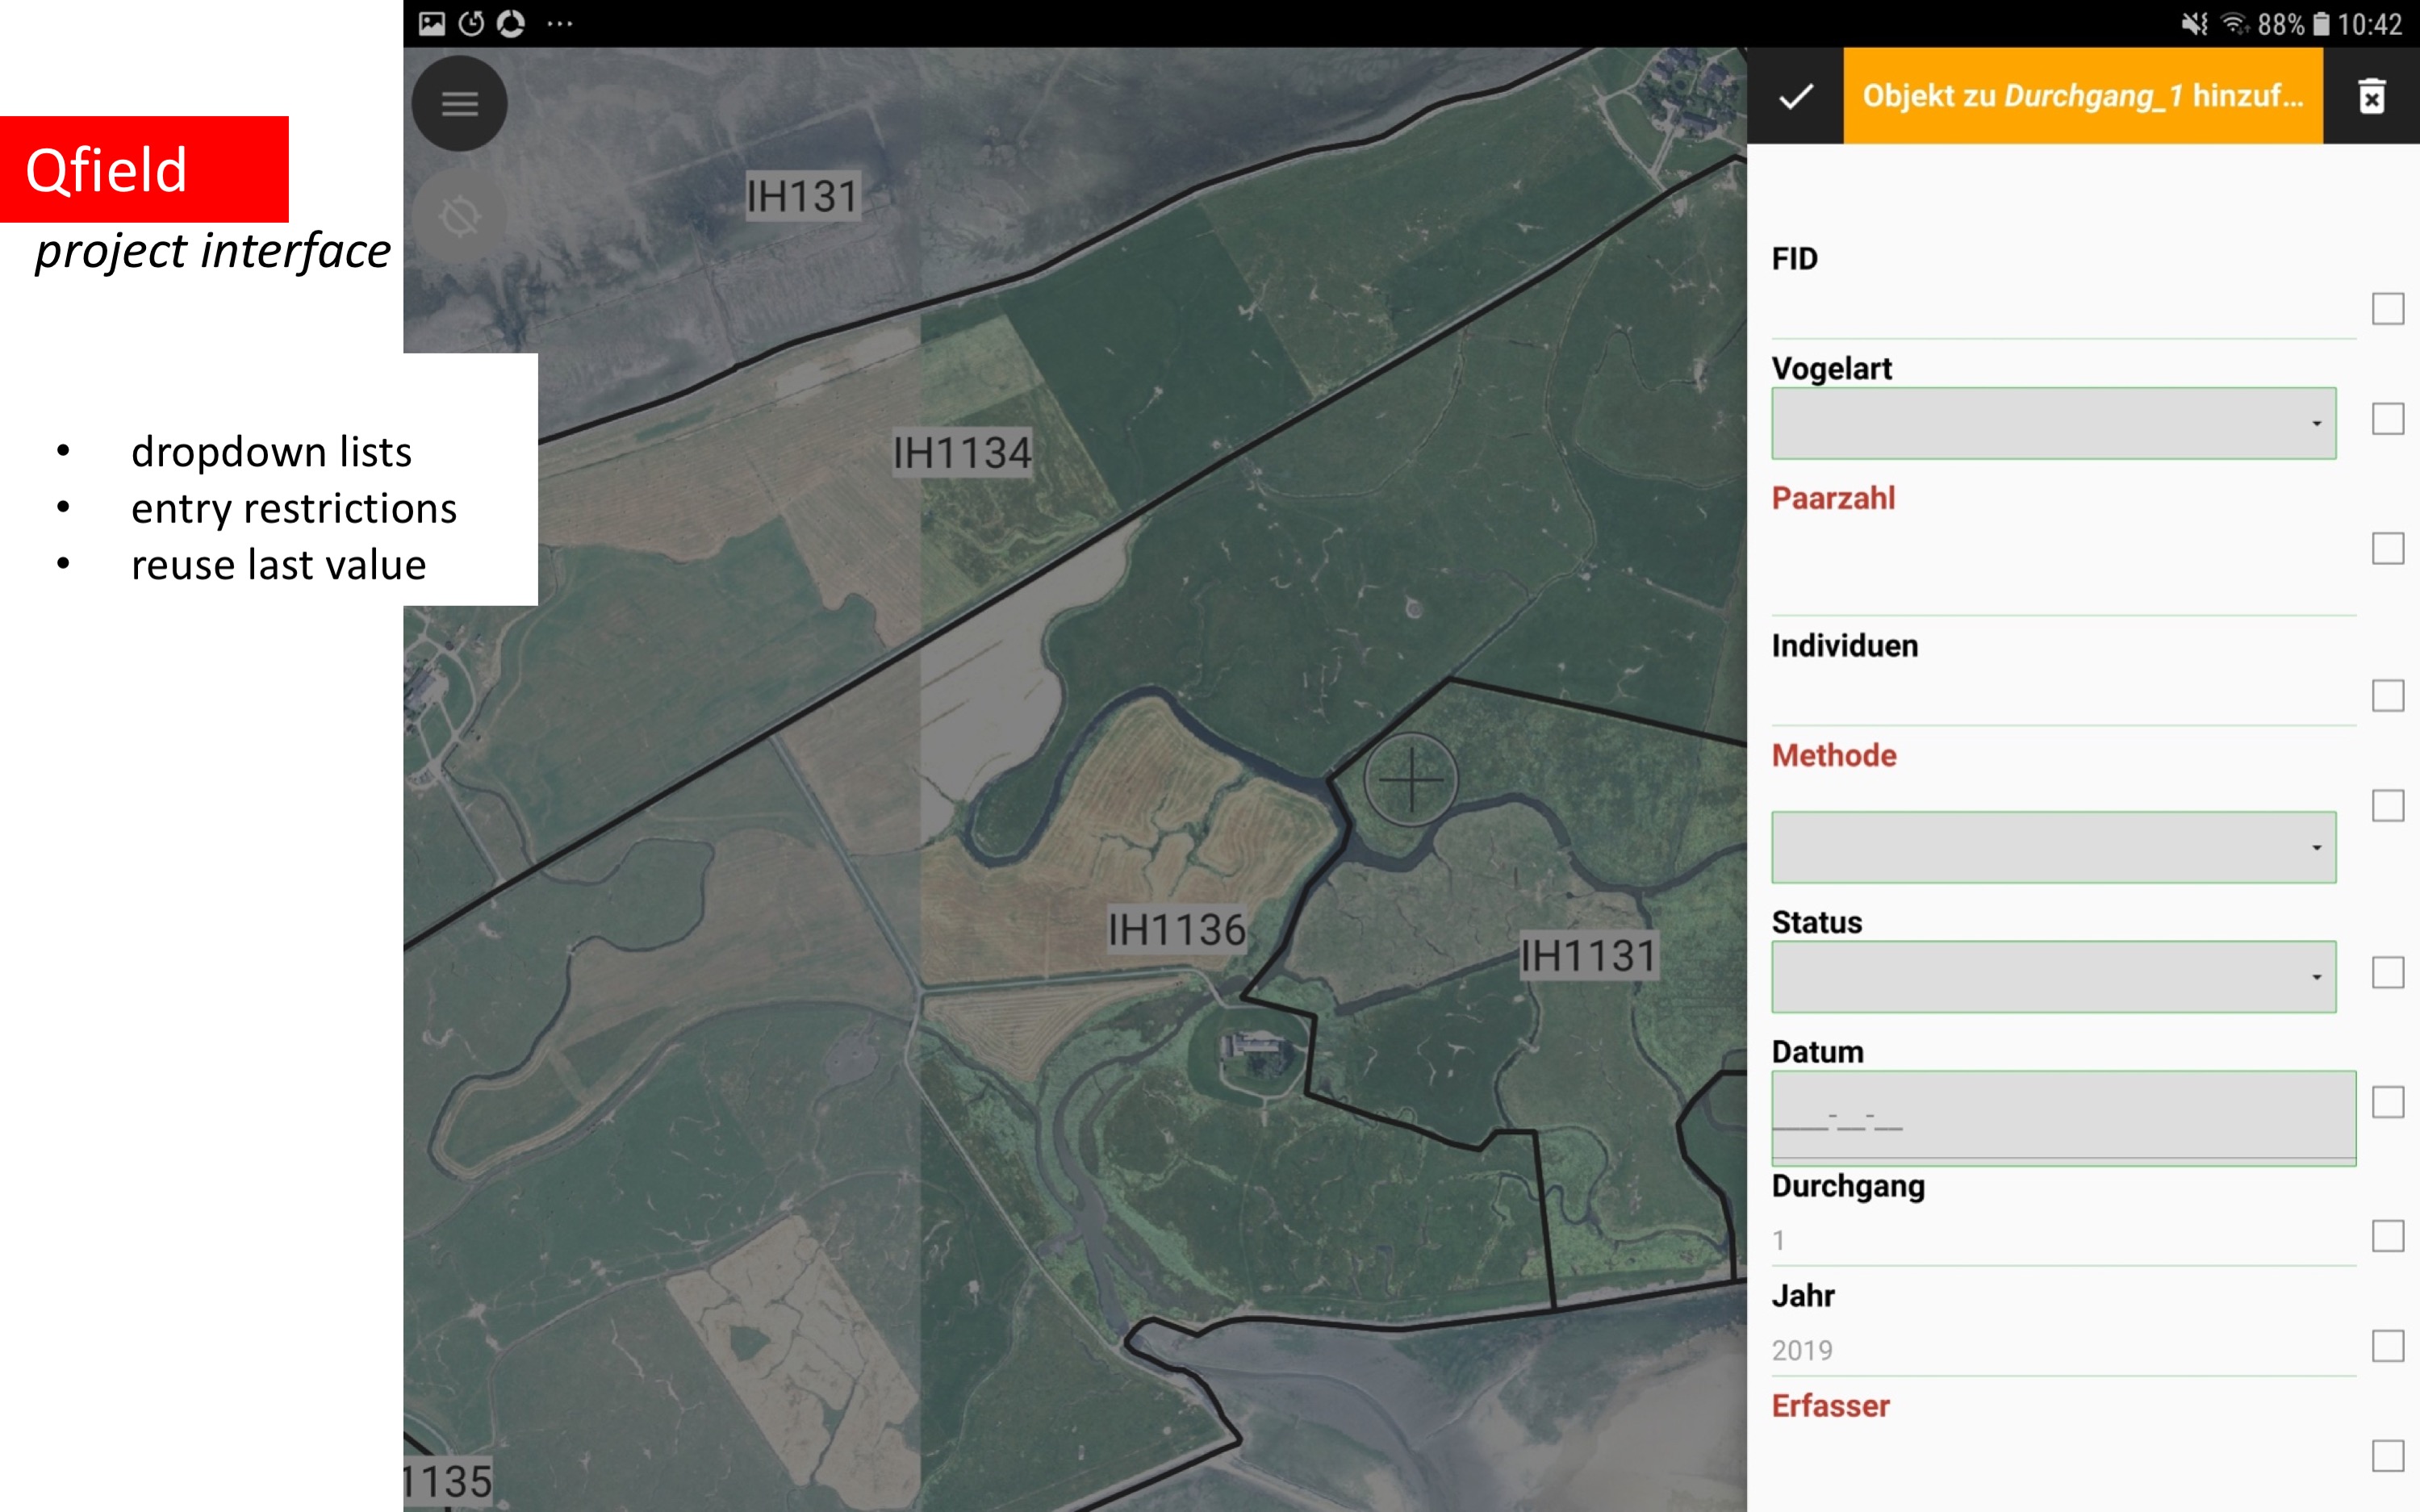
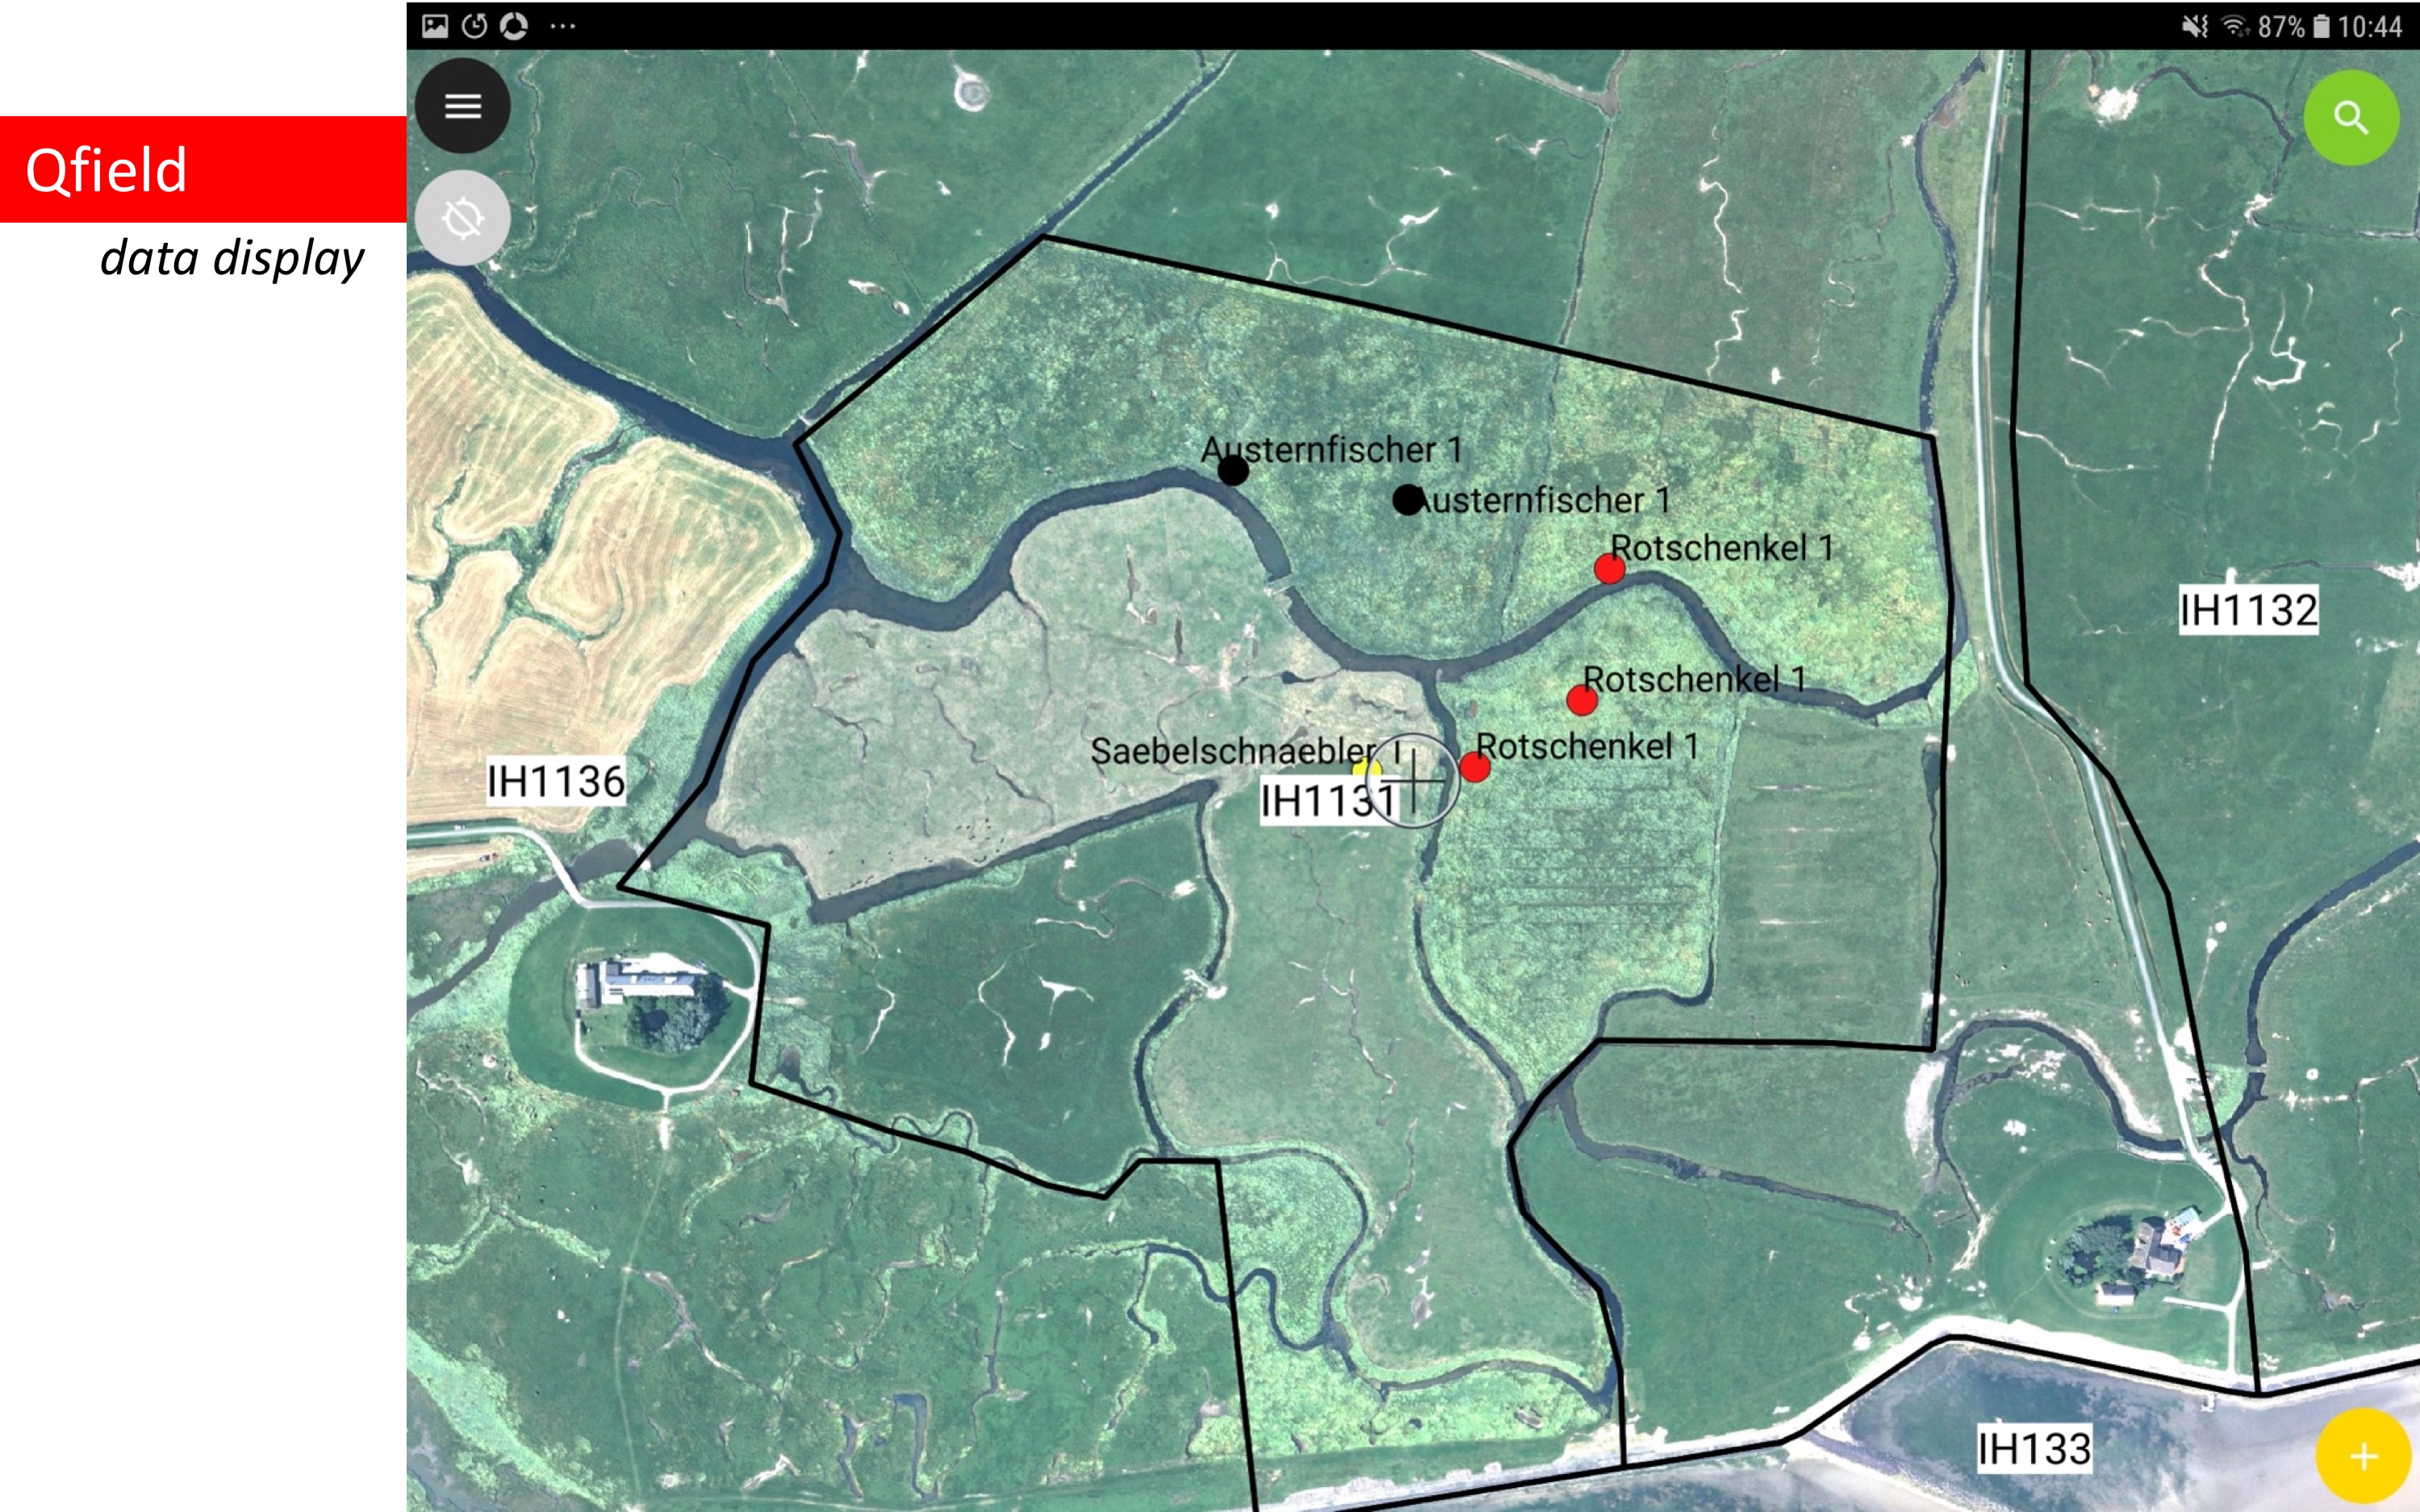
On a desktop computer we set up a QGIS project containing a high-resolution aerial image as background layer for orientation in the field. For the monitoring data we created a custom Geopackage database with predefined dropdown columns and entry restrictions. Additionally, we added predefined walking paths to guide the volunteers and to further standardise our monitoring.
We used an additional synchronisation App that automatically uploaded the field data from the tablet to a Google Drive cloud after fieldwork. For data download, automatized backup, data review and export we wrote a R script.
The general concept of QField as a simplified field application of QGIS turned out to be very useful for our work with volunteers. While we can set up a project with a high level of customization including all our needs in QGIS, field workers only need to understand the basics. A big advantage: unwanted changes are almost impossible in QField.
During field work orientation was much easier on the tablets compared to printed paper maps especially in the extensive salt marshes. Data entry was pretty fast thanks to the possibility to automatically reuse the last entered value. Logging observations on the tablet only took a little bit extra time in comparison to paper maps.
We had no software problems during a testing period in spring 2019 and everything worked as planned. In an evaluation survey all participants stated that they preferred using the tablet rather than the analogue paper maps for field work. The use of the custom QField project was evaluated as straightforward and easy.
In total more than 18.000 data points were collected in the field. Due to automatized data treatment we saved a huge amount of office time and avoided transmission errors. Also, data collected with tablets and GPS-positioning will be of much higher spatial accuracy. In the future we will thus fully switch to tablet based fieldwork.
We thank the Ernst-Commentz Stiftung, the Europäischer Tier- und Naturschutz Stiftung and the Adolf und Hildegard Isler Stiftung for generously supporting our project. Additionally, we want to thank the developers of QField and R for offering fantastic open source software. It is great that, due to free software, such projects can be implemented by a comparatively small conservation society.